At Cookin, we understand that knowing how your storefront is performing is crucial for making smart, data-driven decisions.
That’s where our new Store Analytics feature, which we recently rolled out, comes in. This powerful tool gives you clear insights into your business, helping you turn more visits into orders and boost your revenue.
With Cookin, you’re not just cooking, you’re running a business; you’re leading the way in the food industry.
How Store Analytics can help chefs
Store Analytics is a crucial tool for chefs because it helps you:
Understand customer behaviour
Monitor the number of visitors to your storefront and observe their actions on your webpage.
Improve your menu
Know which dishes are popular and which ones aren’t, so you can make better decisions about what to offer.
Boost sales
Use data to find out which dishes or promotions work best and attract more customers.
Plan better
Understand trends over time to better plan your menu, ingredient purchases, and reduce waste.
Stay competitive
Keep track of your performance and find ways to improve, staying ahead of the competition.
Measure marketing impact
See how your marketing efforts drive traffic to your storefront and affect sales, giving you a complete picture of your strategy’s success
Track business trends
Monitor trends over various time frames (past week, month, year, and all time) to understand the bigger picture of your business performance.
Gain actionable insights
- If you notice a spike in visits but a drop in orders, rethink your menu to better meet customer expectations and convert those visits into sales
- Compare current data with past performance to spot successful menu items and promotions, helping you refine your offerings and strategies for better results.
How it works
1. Accessing your Store Analytics
- Open your Cookin Business Manager.
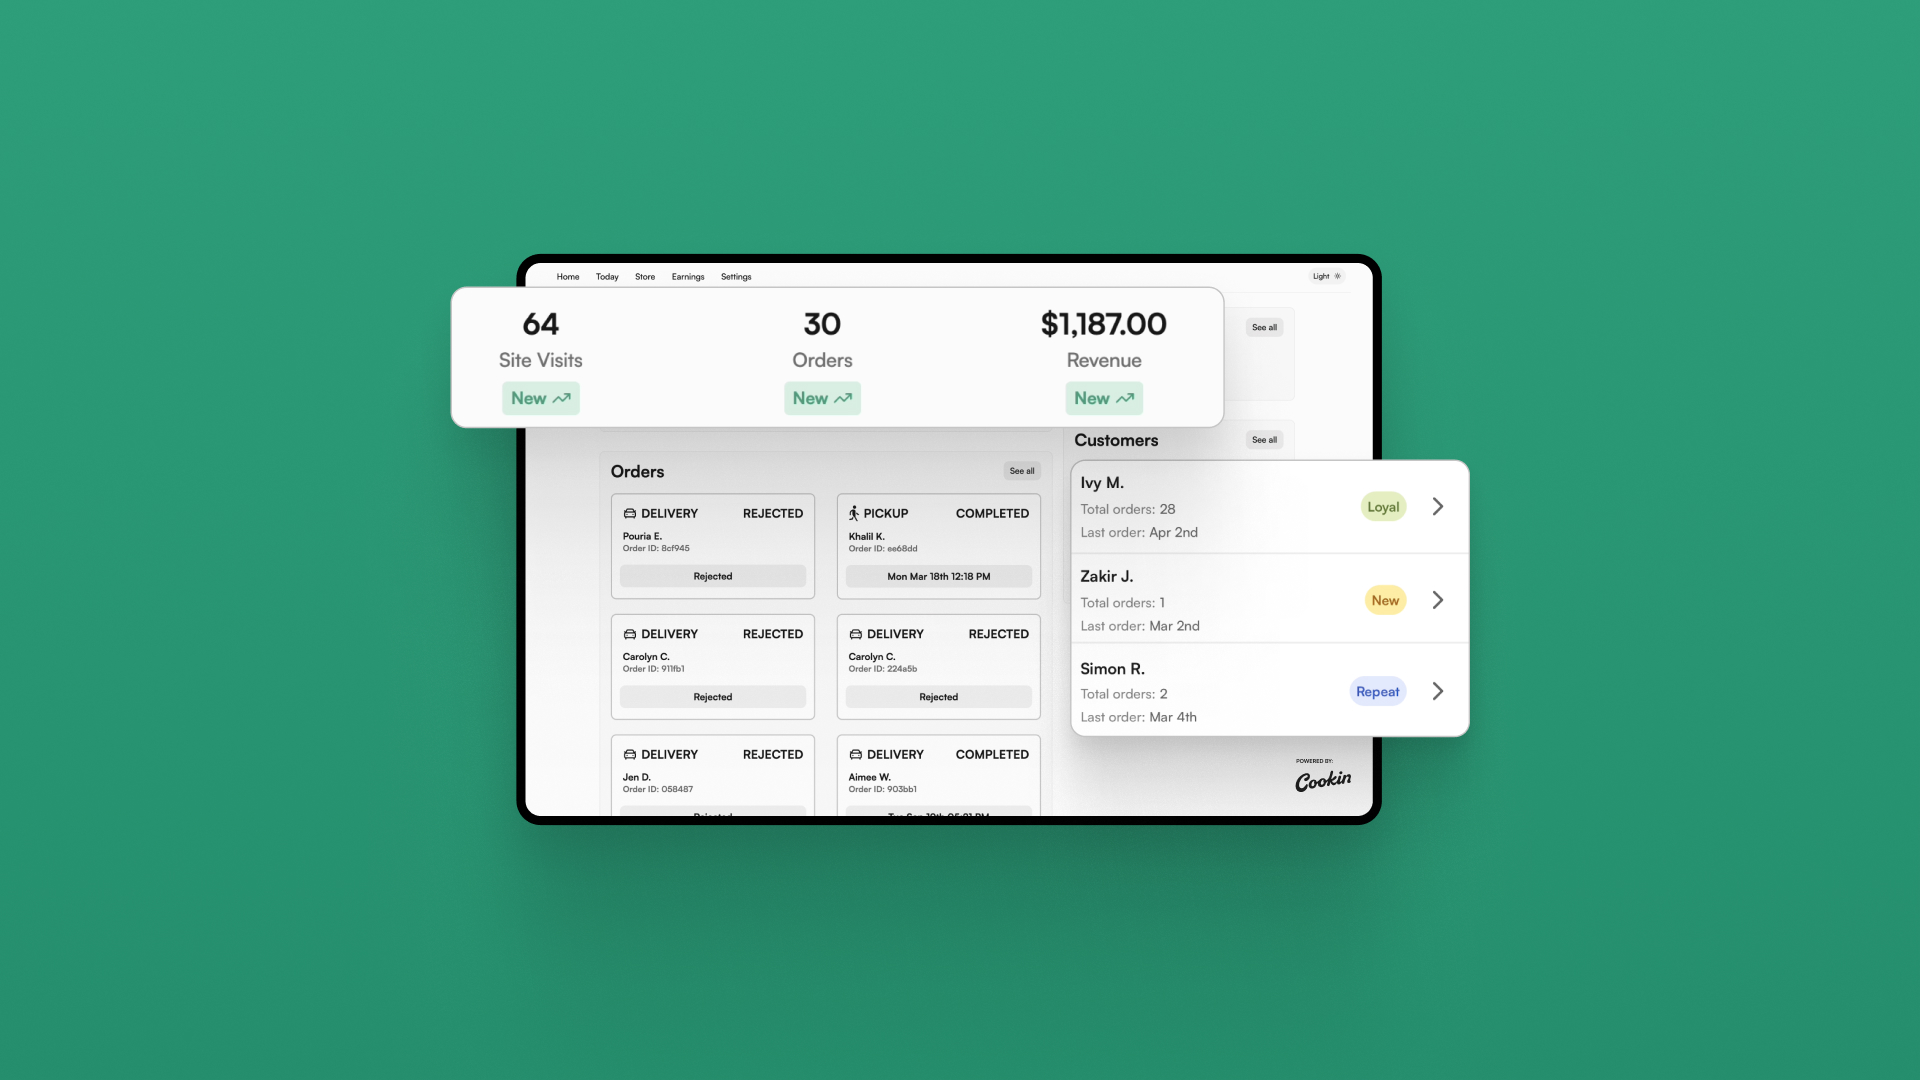
- Your Store Analytics will be displayed at the top of the home tab.
2. Key Metrics Displayed
- Storefront Visits: See how many people have checked out your storefront.
- Orders: Track the number of purchases made.
- Order Revenue: View the total purchase volume within a specified time frame.

3. Filtering and Comparisons
- Filter these analytics by past week, month, year, or all time.
- Below each number, see a comparison to the previous period (week, month, year, or all-time performance).
- Percentage changes show how metrics compare to previous periods (e.g., week 1 compared to the previous week).

How to maximize store analytics insights for your business success
Here are some actionable ideas for how you can use store analytics insights:
Marketing campaigns
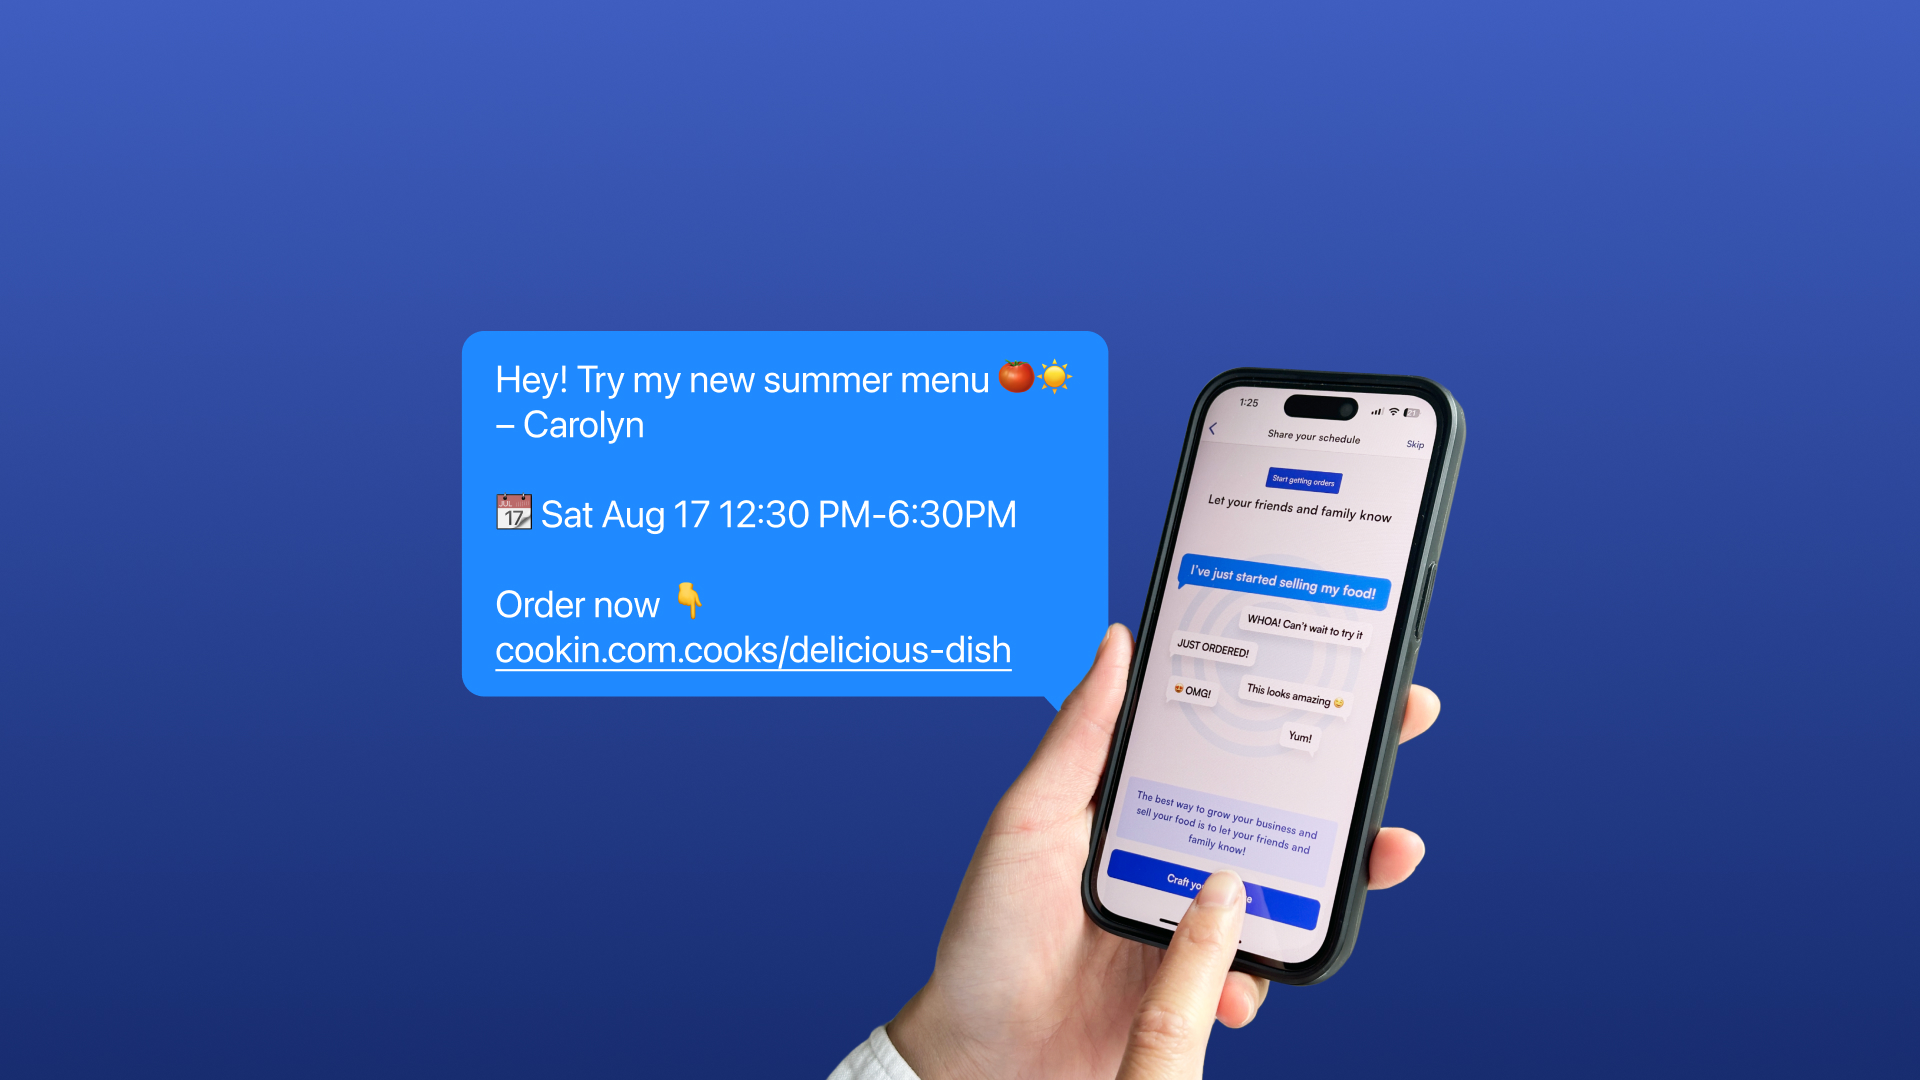
Create marketing efforts such as social media posts, ads and promotions that bring more customers into your store when your analytics show things are quiet. Over time, you’ll learn what kind of marketing has an impact on store visits.
Promote best-sellers
Identify your top-selling dishes and promote them more heavily, both online and in-store.
Revamp underperforming items
Use insights to determine which menu items are not performing well and consider revamping or replacing them.
Optimize pricing
Analyze sales data to adjust your pricing strategy for maximum profitability.
Targeted promotions
Create targeted promotions based on customer purchasing patterns to increase repeat business.
Seasonal adjustments
Track sales over different seasons to adjust your menu and promotions accordingly.
Inventory management
Plan your inventory purchases based on the popularity of items to reduce waste and ensure you have enough stock of popular dishes.
By using these tips, you can make the most of store analytics to improve how you run your business and make your customers happier, leading to more success and growth.
Conclusion
The Store Analytics feature is here to help you get a better grasp of your business. By keeping an eye on key metrics and comparing them over time, you can make smarter decisions that boost customer engagement and sales. Try out the Store Analytics section today and take your culinary business to the next level with Cookin!
